彩色.svg)

If you are looking for the busiest ports in the United States, you need hard numbers, not guesses.
The 2025 numbers are in, and the leaderboard has shifted. Long Beach has overtaken New York/New Jersey, and the Port of Los Angeles has broken a historic 10-million TEU threshold.
In logistics, volume equals capacity (and often, congestion). Knowing who is handling the most cargo helps you predict where the bottlenecks will be.
In this guide, we have compiled the official Top 15 US Ports based on the verified 2025 annual TEU volume reported by Port Authorities.
We don’t just list them; we analyze which one is the right entry point for your cargo.
Let’s look at the data.
Top 15 US Ports 2025
The following ranking is based on total container volume (Imports + Exports + Empties) verified from 2025 financial reports.
| Rank | Port Name | Coast | Annual Volume (TEU) | Primary Strength |
|---|---|---|---|---|
| 1 | Port of Los Angeles | West | ~10.3M | The perennial #1. High speed; the only US port to exceed 10M TEU. |
| 2 | Port of Long Beach | West | ~9.9M | Reclaimed #2 spot. Best-in-class automation & “Green Port” tech. |
| 3 | Port of NY / NJ (PANYNJ) | East | ~9.0M | #1 on East Coast. Direct access to the massive Northeast consumer base. |
| 4 | Port of Savannah | East | ~5.8M | Fastest Growing. Top choice for E-commerce & Mega Warehousing. |
| 5 | Port of Houston | Gulf | ~4.3M | The “Texas Boom.” Best for reaching the Midwest via truck. |
| 6 | Port of Virginia | East | ~3.4M | Deepest harbor on East Coast (55ft); Semi-automated terminals. |
| 7 | NW Seaport (Seattle/Tacoma) | West | ~3.3M | Rebounded +12%. Closest geographic point to Asia (Fast ocean transit). |
| 8 | Port of Charleston | East | ~2.5M | Manufacturing hub (BMW/Volvo); Opened new Leatherman Terminal. |
| 9 | Port of Oakland | West | ~2.3M | The primary export gateway for US Agriculture & Northern CA tech. |
| 10 | Port of Jacksonville (JAX) | East | ~1.4M | Top 10 Entry. #1 for Vehicles; key hub for Puerto Rico trade. |
| 11 | Port of Miami | East | ~1.1M | “Cargo Gateway to the Americas” (LATAM transshipment focus). |
| 12 | Port Everglades | East | ~1.1M | Record year; strong in energy products & perishables. |
| 13 | Port of Philadelphia | East | ~0.89M | Record Growth (+6%). Overtook Baltimore; specialized in Cold Chain. |
| 14 | Port of Baltimore | East | ~0.80M | World-leader in Ro-Ro (Cars/Machinery); solid rail connections. |
| 15 | Port of Mobile | Gulf | ~0.60M | Fastest growing Gulf port; Overtook New Orleans in container volume. |
The Big 5 Ports Analyzed
1. Port of Los Angeles (POLA)

- 2025 Status: The undisputed King. It handled ~10.3 million TEUs, marking one of its busiest years ever.
- The Reality: Despite trade policy uncertainty, LA remained fluid with no congestion reported in 2025. It handles the most China-US trade because it has the most frequent sailings.
- Best For: Importers who prioritize speed. Transit from Shenzhen can be as fast as 14-16 days.
2. Port of Long Beach (POLB)
- The Reality: In recent years, NY/NJ has occasionally surpassed Long Beach to take the #2 (or even #1) spot during West Coast labor strikes. It is the dominant force on the East Coast.
- The Advantage: It allows you to bypass the cross-country rail network entirely if your customers are in the Northeast.
- Best For: Retail goods destined for the densely populated East Coast corridor.
3. Port of New York and New Jersey (PANYNJ)
- 2025 Status: Slipped to #3 with ~9.0 million TEUs , but remains the dominant force on the East Coast.
- The Strategy: It handles nearly 35% of its cargo via the Suez Canal/Atlantic, offering diversification from Trans-Pacific risks.
- Best For: Retail goods destined for the 100 million consumers living within 24 hours of the port.
4. Port of Savannah
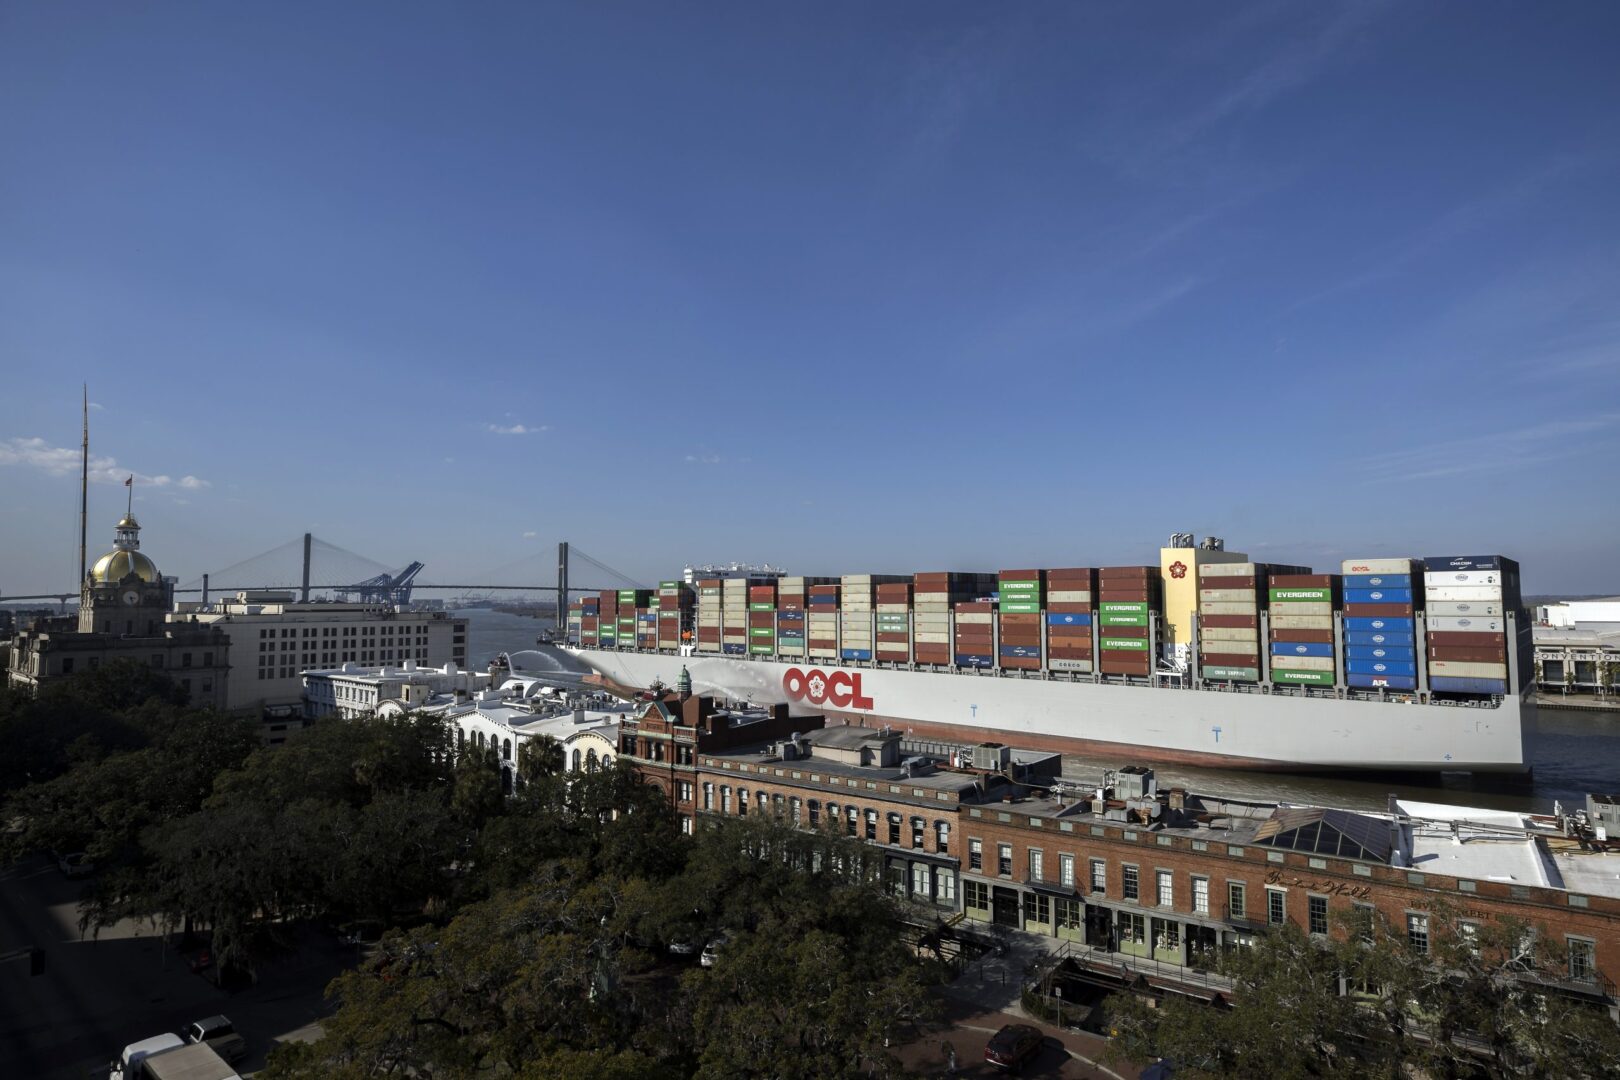
- 2025 Status: The growth engine. Volume hit ~5.8 million TEUs , driven by the completion of the Mason Mega Rail project which doubled rail capacity.
- The Why: Land. Unlike LA or NY, Georgia has abundant, affordable land. This has created a massive ecosystem of “Big Box” Fulfillment Centers (Target, Wayfair) near the port.
- Best For: E-commerce sellers and businesses setting up large-scale 3PL distribution hubs.
5. Port of Houston
- 2025 Status: The “Texas Boom” continues with a record ~4.3 million TEUs.
- Key Upgrade: The Project 11 expansion is substantially complete, allowing Neo-Panamax vessels to call efficiently.
- Best For: Reaching Dallas and the Midwest. Shipping to Houston and trucking north avoids the expensive cross-country rail from California.
Speed vs. Cost (How to Choose)
Now that you have the verified data, how do you choose?
Don’t just pick #1 because it’s the biggest. Here is the framework we use at ZggShip:
1. The "West Coast" Strategy (LA/LB/Seattle)
- Goal: Maximum Speed.
- Pros: Shortest transit time from Asia (14-20 days).
- Cons: Higher inland transport costs. Railing a container from LA to Chicago can cost $1,500 more than shipping it closer to the destination.
- Choose this if: You are shipping seasonal goods (fashion/toys) where time-to-market is critical.
2. The "East Coast" Strategy (NY/Savannah)
- Goal: Economy & Reliability.
- Pros: Lower total landed cost for East Coast customers. Bypasses potential West Coast labor risks.
- Cons: Longer transit time (30-40 days via Panama Canal).
- Choose this if: Your warehouse is East of the Mississippi and you can plan for longer lead times.
3. The "Four-Corner" Strategy (Diversification)
Post-2022, smart importers don’t put all their eggs in one basket. Industry experts now recommend a “Four-Corner Strategy”.
- The Split: Ship 60% to the West Coast (Speed) and 40% to the East/Gulf Coast (Safety).
- The Benefit: If a strike or congestion hits one coast, your supply chain doesn’t stop.
Your Next Move: Route Optimization Analysis
Choosing the wrong port can add $1,500 to your inland trucking bill.
Do you need speed? Or do you need the cheapest landed cost?
Let us run the numbers.
Send us your destination zip code. We will compare the Total Landed Cost (Ocean + Trucking) for routing via Los Angeles vs. New York vs. Houston.